Simplify Complex Data with the Four Branches Process Mind Map
Making sense of layered business information doesn’t have to mean wrestling with endless bullet points or disjointed diagrams. The Four Branches Process Mind Map Slide Template translates dense concepts into a clear visual structure that feels both intentional and effortless. It combines precise hierarchy levels, ready-to-adapt graphs, and interconnected diagrams so you can move from raw numbers to a narrative that actually resonates.
What You Actually Get in the Slide Template
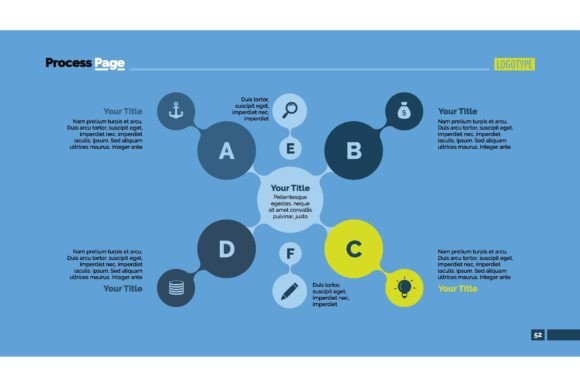
At the heart of the template is a central node from which four distinct branches radiate outward. Each branch accommodates multiple sub-levels — you can attach statistics, timelines, icons, or descriptive text without overcrowding the slide. The layout is pre-balanced; someone already did the visual math so your content stays readable no matter how much detail you add. The graphs aren’t decorative afterthoughts. They let you embed trends, percentage comparisons, or performance snapshots directly into the branches, which is especially helpful if you’re presenting quarterly reviews or project milestones in a banking, management, or finance setting.
The color palette is subdued enough to feel corporate but varied enough to separate ideas at a glance. Because everything is editable, you can swap in your brand colors, adjust line weights, or add your own chart data without starting from scratch. That blend of artistry and practicality means the slide doesn’t just look good — it actively reduces the time you spend figuring out how to arrange information.
Why Different Audiences Connect with This Resource
A well-structured mind map slide registers differently with a marketing lead than it does with a university lecturer. The common thread is the need to simplify, but the nuance matters.
For Professionals in Finance and Management
When you’re presenting a risk assessment breakdown or a capital allocation strategy, every branch carries weight. The Four Branches Process Mind Map Slide Template lets you assign precise metrics to each fork — for example, one branch might unpack revenue streams while another details cost drivers, a third highlights compliance steps, and the fourth maps contingency plans. Stakeholders don’t have to bounce between slides to follow your logic, which means fewer clarifying questions and more confident decision-making.
For Educators and Trainers
Explaining a framework like supply chain stages or cognitive learning domains often benefits from a single visual scaffold. You can place the core concept in the center and use the four branches to introduce sub-topics, then drill down further in your lecture. Students tend to grasp relationships faster when they see them mapped spatially rather than listed linearly. The template also gives you a ready-made structure for handouts or digital course materials — just re-skin with your institution’s colors.
For Entrepreneurs and Small Business Owners
Pitch decks and investor updates demand clarity under pressure. You probably don’t have a design team, so a slide that already holds its shape when you drop in your business model components (product, market, revenue model, growth plan) saves hours of tweaking. Because the template can double as an infographic for your website or social media, you get more mileage from a single asset. The professional finish also signals that you take your data seriously, even if your design skills are basic.
For Marketers and Content Creators
Campaign planning often involves parallel streams: social, email, content, and paid media. Each branch can house key performance indicators, timelines, and creative briefs in one view. When you share the mind map with a client or internal team, everyone aligns around the same strategic picture. Bloggers and freelancers can adapt the slide into downloadable guides or lead magnets, turning complex methodology lists into something people actually want to read.
How Different Skill Levels Approach the Template
Beginners often prioritize speed and safety — they want a structure that won’t look broken if they don’t know advanced PowerPoint or Keynote tricks. The template’s pre-set connectors and text placeholders mean you can type your ideas over the default sample content and end up with a presentable slide in under twenty minutes. There’s no steep learning curve, and the consistency of the design prevents awkward spacing mishaps.
Experienced users might dig deeper. They’ll ungroup objects, add custom animation sequences, or link branches to external data sources for dynamic updates. The template’s layering is clean enough that advanced edits don’t unravel the whole design. For a senior consultant building a recurring client deliverable, this flexibility means the slide can evolve as the project matures without losing its core logic.
Decision Points That Matter Most
Choosing a presentation resource often comes down to a handful of practical concerns. Here’s how the Four Branches Process Mind Map Slide Template addresses those without overpromising.
- Ease of use: The download includes multiple file formats compatible with PowerPoint, Google Slides, and Keynote. You don’t need plugins or subscriptions beyond what you likely already own.
- Quality vs. cost: It’s a one-time asset, not a monthly tool. The visual polish rivals agency-designed slides, so you’re investing in a reusable framework rather than paying for a single bespoke slide.
- Adaptability: You can expand the number of sub-branches or reduce the graph elements. Some users compress it into a two-branch comparison for a simpler talk and restore all four later for a detailed report.
- Presentation impact: The four-part radial layout naturally draws the eye outward from the center, helping audiences remember hierarchical relationships better than a standard table.
- Speed of output: Because the skeleton is complete, you spend your energy refining your message instead of aligning boxes. That turnaround time can be critical when a board meeting is moved up.
- Long-term usefulness: Once you’ve customized the template to your brand, it becomes a drag-and-drop asset for future projects, personal planning, or collaborative workshops.
Real-World Applications Across Disciplines
A financial advisor might map a client’s portfolio under four goals: retirement planning, education funding, tax efficiency, and estate liquidity. Each goal branch then includes sub-items like asset allocation percentages or milestone dates. The integrated graphs let the advisor show projected growth without opening a separate spreadsheet, turning a compliance-heavy review into an engaging conversation.
A product manager introducing a feature roadmap could structure it as discovery, development, testing, and launch. The central node holds the product vision, while each branch carries sprint timelines, resource needs, and risk flags. Colleagues from engineering, marketing, and leadership view the same slide and immediately see how their piece connects to the whole.
An independent researcher presenting complex qualitative findings might use the branches to separate themes, citations, case studies, and implications. The visual grouping helps a conference audience absorb the research arc without bouncing back to a dense paper. Even a hobbyist planning a personal event — a community fundraiser, for instance — can adapt the branches into logistics, promotion, sponsorship, and volunteer coordination.
Does This Match Your Project Needs?
If your primary goal is to communicate layered information with minimal friction, this template aligns well. It’s built for situations where you want to show relationships rather than describe them in paragraphs. Start by asking yourself a few questions:
- Will your data benefit from a clear center-and-spoke structure, or does it demand a freeform layout? The rigid elegance of four branches works when your topic can logically be split into primary components — if your material has six equally important pillars, you might need to adjust the structure or consider a different base.
- How much design time can you afford? If you’re up against a deadline and the alternative is a blank slide at 11 p.m., this template is a practical shortcut that doesn’t compromise professionalism.
- Who is your audience? When presenting to executives, investors, or clients accustomed to polished materials, the template’s balanced composition and data-integration features help you meet expectations without a graphic designer on standby.
- Do you need to reuse the asset? If you’ll deliver similar presentations quarterly or train multiple teams, a single adaptable template reduces inconsistency and saves you from reinventing the visual language each time.
The Four Branches Process Mind Map Slide Template won’t automatically create your content or validate your figures, but it removes the visual hurdle that often stands between a rough idea and a clear presentation. By handling the layout, scales, and diagram logic, it frees you to focus on what you do best: interpreting the data and telling its story. Whether you’re walking a client through an investment strategy, teaching a classroom, or mapping your next business move, having a structure that can carry complexity without looking cluttered is a quiet advantage that tends to compound.