Mastering Business Data with the Three Steps Process Chart
Every day, businesses collect mountains of information. Sales figures, customer feedback, market trends, operational metrics—the list goes on. Yet raw data alone rarely drives smart decisions. The real challenge lies in transforming that data into a clear, compelling story. This is where the Three Steps Process Chart becomes an essential tool for business data communication. By breaking down complex workflows or analytical sequences into three digestible stages, this visualization method helps teams grasp information quickly, align on priorities, and take action with confidence.
Whether you are presenting a quarterly review to stakeholders, training new employees on a banking compliance procedure, or mapping out a marketing funnel, the Three Steps Process Chart offers a structured yet flexible framework. Its power comes from simplicity—three carefully chosen phases connected by finely shaped arrows that guide the viewer’s eye naturally from one point to the next. Rather than drowning your audience in spreadsheets and bullet points, you offer them a visual journey that makes even the most intricate business data feel approachable.
Why Business Data Needs a Three-Step Structure
When people encounter too much information at once, they tend to tune out. Cognitive overload is a real obstacle in boardrooms and virtual meetings alike. A Three Steps Process Chart directly addresses this problem. Three is a number that humans find inherently satisfying and easy to remember. Think about it: beginning, middle, end; problem, solution, result; input, process, output. These triads appear across communication strategies precisely because they work with our natural cognitive patterns.
For business data specifically, the three-step format forces you to prioritize. You cannot include every detail. Instead, you must identify the three most critical stages of your data story. This discipline alone improves the quality of your presentations. Your audience receives a focused narrative rather than a chaotic data dump. The result is better retention, clearer understanding, and faster decision-making—all goals that any business professional can appreciate.
Turning Complex Business Data into a Visual Journey
Most business data lives in tables, databases, and dashboards that only a handful of analysts truly understand. The Three Steps Process Chart acts as a bridge between that technical depth and the broader audience who needs to act on the insights. Imagine you have a complex customer acquisition report spanning multiple channels, demographics, and time periods. Trying to explain every variable in a single slide would overwhelm anyone. But distilling that report into three sequential stages—such as Awareness, Engagement, and Conversion—immediately clarifies the flow.
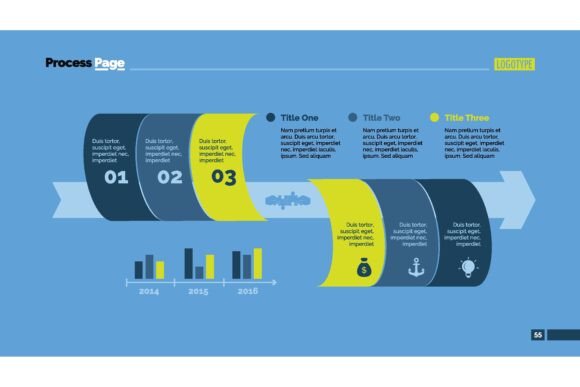
Finely shaped arrows and ingenious diagrams do more than decorate the page. They serve as visual cues that tell the brain “this follows that.” When you pair these design elements with business data points inside each stage, you create a graphic flow that transforms static numbers into a moving narrative. A stakeholder can see at a glance where the biggest drop-off occurs, where resources are concentrated, and where opportunities lie. This seamless blend of style and substance makes your message land with impact.
Practical Applications Across Marketing and Training
Consider the dynamic world of marketing. Campaign strategists constantly juggle audience segments, content calendars, and performance metrics. A Three Steps Process Chart can map out a complete campaign lifecycle: Plan, Execute, Optimize. Within each step, you embed relevant business data such as budget allocation, engagement rates, or conversion metrics. The chart becomes both a planning tool and a reporting asset. Teams can use it during brainstorming sessions to align on objectives and later reuse it to show clients exactly how their investment performed.
In training programs, the three-step format works brilliantly for instructional design. Trainers often need to explain procedures, software workflows, or safety protocols. A process chart with three clear stages helps learners build mental models without feeling overwhelmed. For instance, a customer service training module might use a Listen, Resolve, Follow-Up chart. Each step would include key business data points such as average handling time targets, customer satisfaction scores, or first-contact resolution rates. Learners absorb the process while also understanding the metrics that define success.
How Banking and Finance Leverage the Three-Step Model
The intricate sphere of banking demands clarity and precision. Compliance processes, loan approval workflows, and risk assessment frameworks all involve multiple steps that must be followed rigorously. A Three Steps Process Chart brings structure to these often dense procedures without sacrificing necessary detail. A loan origination process, for example, could be visualized as Application Review, Underwriting, and Approval & Funding. Each stage can house relevant business data such as document requirements, credit score thresholds, and turnaround time benchmarks.
Banking professionals also face the constant need to explain complex products to clients. A financial advisor presenting investment options might use a three-step chart to illustrate the journey from Risk Assessment to Portfolio Selection to Ongoing Management. By embedding performance data, fee structures, and projected outcomes within the chart, the advisor turns a potentially intimidating conversation into an engaging visual story. Clients leave with a clear understanding of not only what is being recommended but why the recommendation makes sense based on the data.
Designing Your Own Three Steps Process Chart for Business Data
Creating an effective chart starts with identifying the core message you want to communicate. Ask yourself: what three stages best represent the journey of this particular business data? Avoid the temptation to cram four or five steps into the framework. The strength of this approach lies in its restraint. Once you have your three steps, assign each one a distinct visual space—perhaps using different colors, icons, or diagram shapes to differentiate them.
Next, decide which data points belong in each step. Choose metrics that directly support the narrative of that stage. If step one is about identifying a problem, include data that quantifies the problem. If step two involves implementing a solution, show resource allocation or timeline data. Step three should demonstrate results, so include outcome metrics that prove the impact. The arrows connecting these stages should feel intentional—finely shaped to suggest forward momentum and logical progression.
Finally, consider your audience. A chart prepared for an executive team should highlight high-level business data and strategic implications. A chart for an operational team should drill into process-specific metrics and actionable details. The Three Steps Process Chart adapts gracefully to both contexts because its underlying structure remains consistent while the content scales up or down in complexity.
Overcoming Common Challenges with Business Data Visualization
One of the biggest hurdles professionals face is the temptation to include everything. When you have spent weeks analyzing business data, it feels natural to want to share every finding. But effective communication requires editing. The Three Steps Process Chart forces you to curate. If a data point does not serve one of the three stages, consider whether it truly needs to be in the visual. You can always provide supplementary materials for those who want deeper dives.
Another challenge is ensuring that the visual design enhances rather than distracts. Unique design elements and ingenious diagrams should serve the data, not overshadow it. Choose a cohesive color palette, keep fonts legible, and make sure the flow from step one to step three is unmistakably clear. White space is your ally—it gives each element room to breathe and helps the viewer focus on what matters most.
Real-World Scenarios Where the Three-Step Approach Shines
Let’s explore a few concrete examples to see how the Three Steps Process Chart brings business data to life. Imagine a supply chain manager presenting an efficiency improvement plan. The chart could outline Current State, Proposed Changes, and Projected Outcomes. Current state data might include delivery delays, inventory costs, and supplier performance scores. Proposed changes would detail specific process adjustments, while projected outcomes would forecast cost savings and delivery time improvements. The audience sees the entire logic chain in one cohesive view.
In human resources, a talent retention strategy might flow through Attract, Develop, and Retain. Business data such as recruitment funnel metrics, training completion rates, and employee satisfaction scores populate each phase. HR leaders can use this chart to secure executive buy-in by clearly linking investments in development programs to measurable retention outcomes. The visual format makes the business case impossible to ignore.
For product development teams, a launch roadmap visualized as Research, Build, Launch helps cross-functional partners understand where the product stands at any given moment. Each step can include market research findings, development milestones, and go-to-market metrics. The chart becomes a living document that evolves as new business data emerges, keeping everyone aligned without endless status meetings.
Making the Three Steps Process Chart Part of Your Workflow
Adopting this method does not require a complete overhaul of how you work. Start small. The next time you prepare a presentation or report, identify one section where a three-step visualization could replace a dense slide or paragraph. Experiment with different diagram styles—horizontal flows, vertical cascades, or even circular arrangements that return to the starting point. Notice how your colleagues respond. Chances are, they will engage more actively and ask more insightful questions because the information feels accessible.
Over time, you will develop an instinct for spotting opportunities where the Three Steps Process Chart can clarify business data. Your templates will evolve, your design sense will sharpen, and your communication effectiveness will grow. What begins as a simple graphic tool becomes a strategic asset that sets your work apart in a world flooded with information. The goal is not to replace detailed analysis but to give it a front door that invites people in.
The Lasting Value of Simplified Business Data Communication
Business data will only continue to grow in volume and complexity. The professionals who thrive will be those who can distill that complexity into clarity. The Three Steps Process Chart offers a proven path to that clarity. It respects your audience’s time and cognitive capacity while honoring the depth of your analytical work. When style and substance unite in each detail—from the finely shaped arrows to the carefully chosen metrics inside each diagram—you create something that transcends a typical report. You create an experience that informs, persuades, and inspires action.
Whether you work in marketing, training, banking, or any other field that depends on smart decisions driven by accurate information, this approach belongs in your toolkit. Embrace the power of three. Let your business data tell stories that move people. And watch as your presentations transform from forgettable to unforgettable, one step at a time.